Your demos look fine. Does your pipeline?
Send us read access and we will show you which campaigns actually close.
Share this Article


Key takeaways
Demo count measures an action. Revenue measures whether the action was worth anything. Most B2B SaaS teams optimise Google Ads on the first and wonder why the second never arrives.
Track every lead past the demo to sales qualified, opportunity and closed won. The drop between each stage is where your lead quality actually lives.
Send those outcomes back into Google Ads so the bidding learns from revenue instead of form fills.
Give it one full sales cycle, 45 to 90 days, before closed-won data can steer your bidding or your budget.
A booked demo tells you someone filled in a form. It does not tell you whether they can buy. Here is how to measure Google Ads lead quality by what the sales team closes.
Why are booked demos a misleading measure of Google Ads performance?
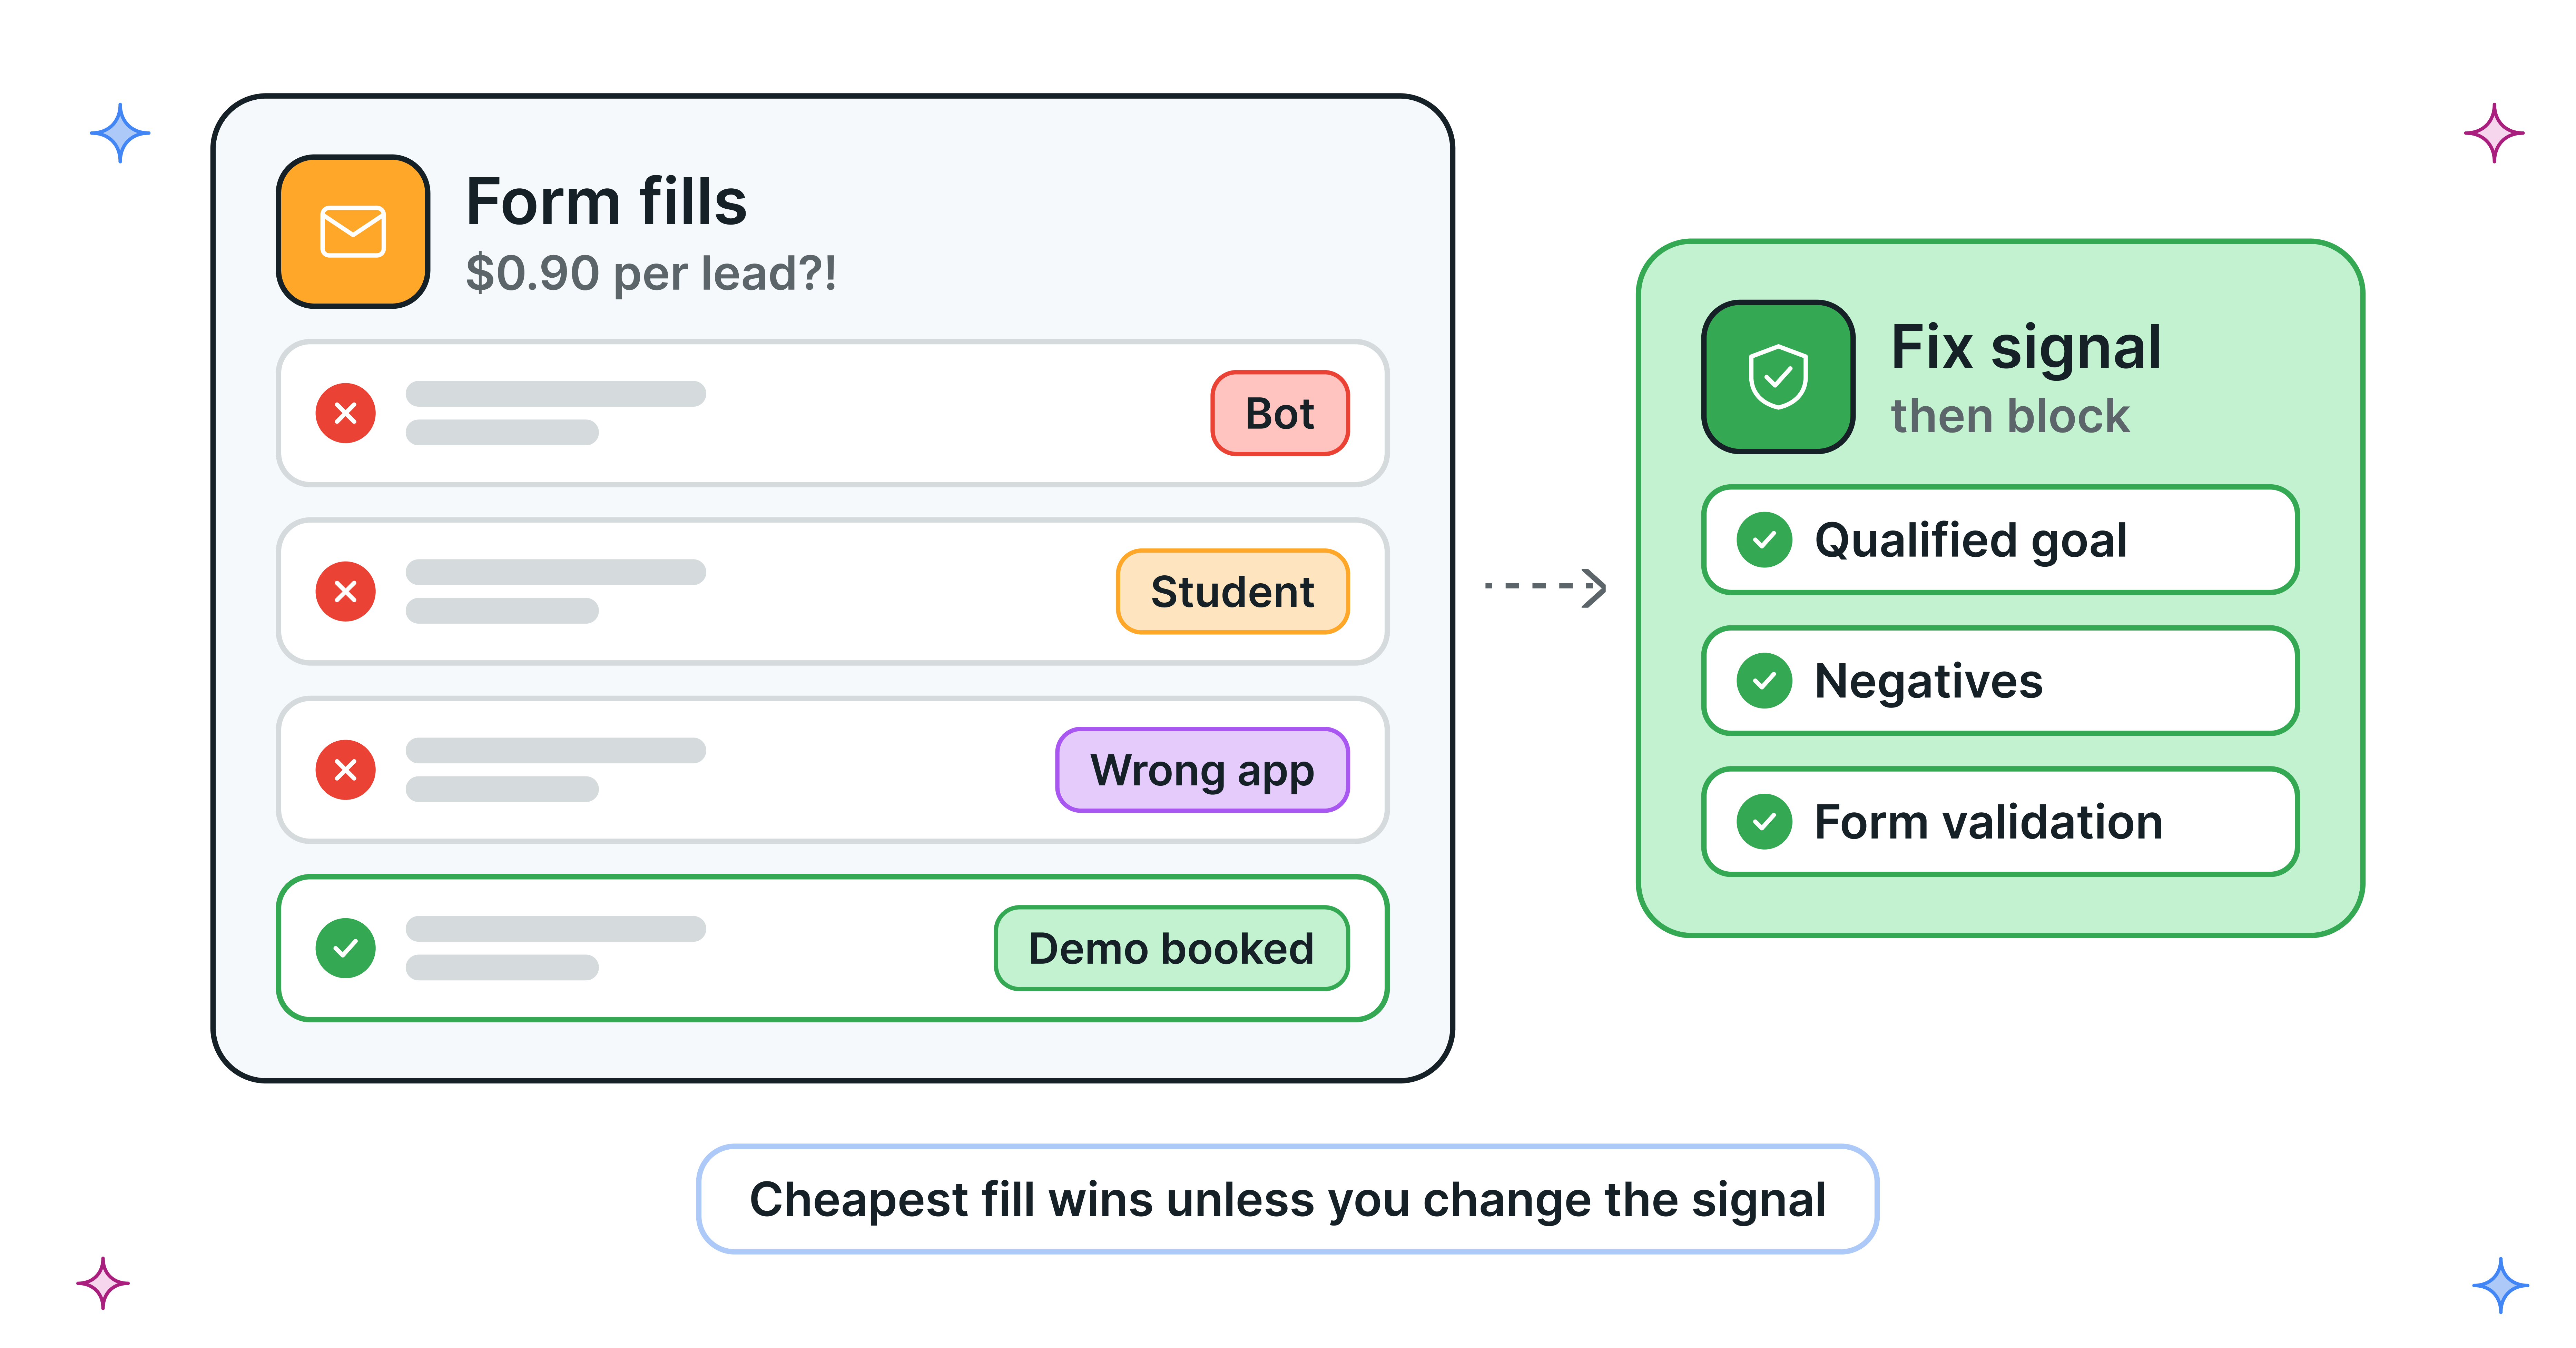
Because a booked demo records an action, not an outcome. Two campaigns can produce the same number of demos and completely different amounts of revenue.
Here is the pattern we see in almost every account we take over. A brand campaign and a competitor campaign each book ten demos in a month. On a demo-count report they look identical. Three months later, the brand demos have produced six opportunities and two closed deals. The competitor demos have produced one opportunity and nothing closed.
Same cost per demo. Very different businesses.
This gets worse in B2B SaaS because buyers do most of their work before they ever talk to you. Gartner surveyed 646 B2B buyers and found that 67% prefer a rep-free buying experience. By the time someone books a demo, they have already made up a lot of their mind. Some are ready to buy. Some are students. Some are competitors. Some work at a company one tenth of your minimum deal size. Your demo counter treats all four the same.
If you cannot tell a good demo from a bad one in your reporting, neither can Google's bidding algorithm.
What does lead quality actually mean in B2B SaaS?
Lead quality is the share of your leads that the sales team can genuinely sell to, measured by how far those leads travel down the funnel rather than by how they behaved on your website.
Website behaviour, like time on page or pages visited, is a guess about quality. Funnel progress is evidence of it. There are four stages worth tracking, and most teams only track the first.
- Booked demo. Someone scheduled a meeting. This is where most reporting stops.
- Sales qualified lead (SQL). A salesperson met them and confirmed they fit, have a budget and have a real problem.
- Opportunity. A deal with a value and a close date now exists in the CRM.
- Closed won. They paid.
The drop between each stage is where your lead quality actually lives. A campaign that turns 60% of demos into SQLs is doing a very different job from one that turns 15% of demos into SQLs, even when both cost the same per demo.
Which metrics should replace cost per booked demo?
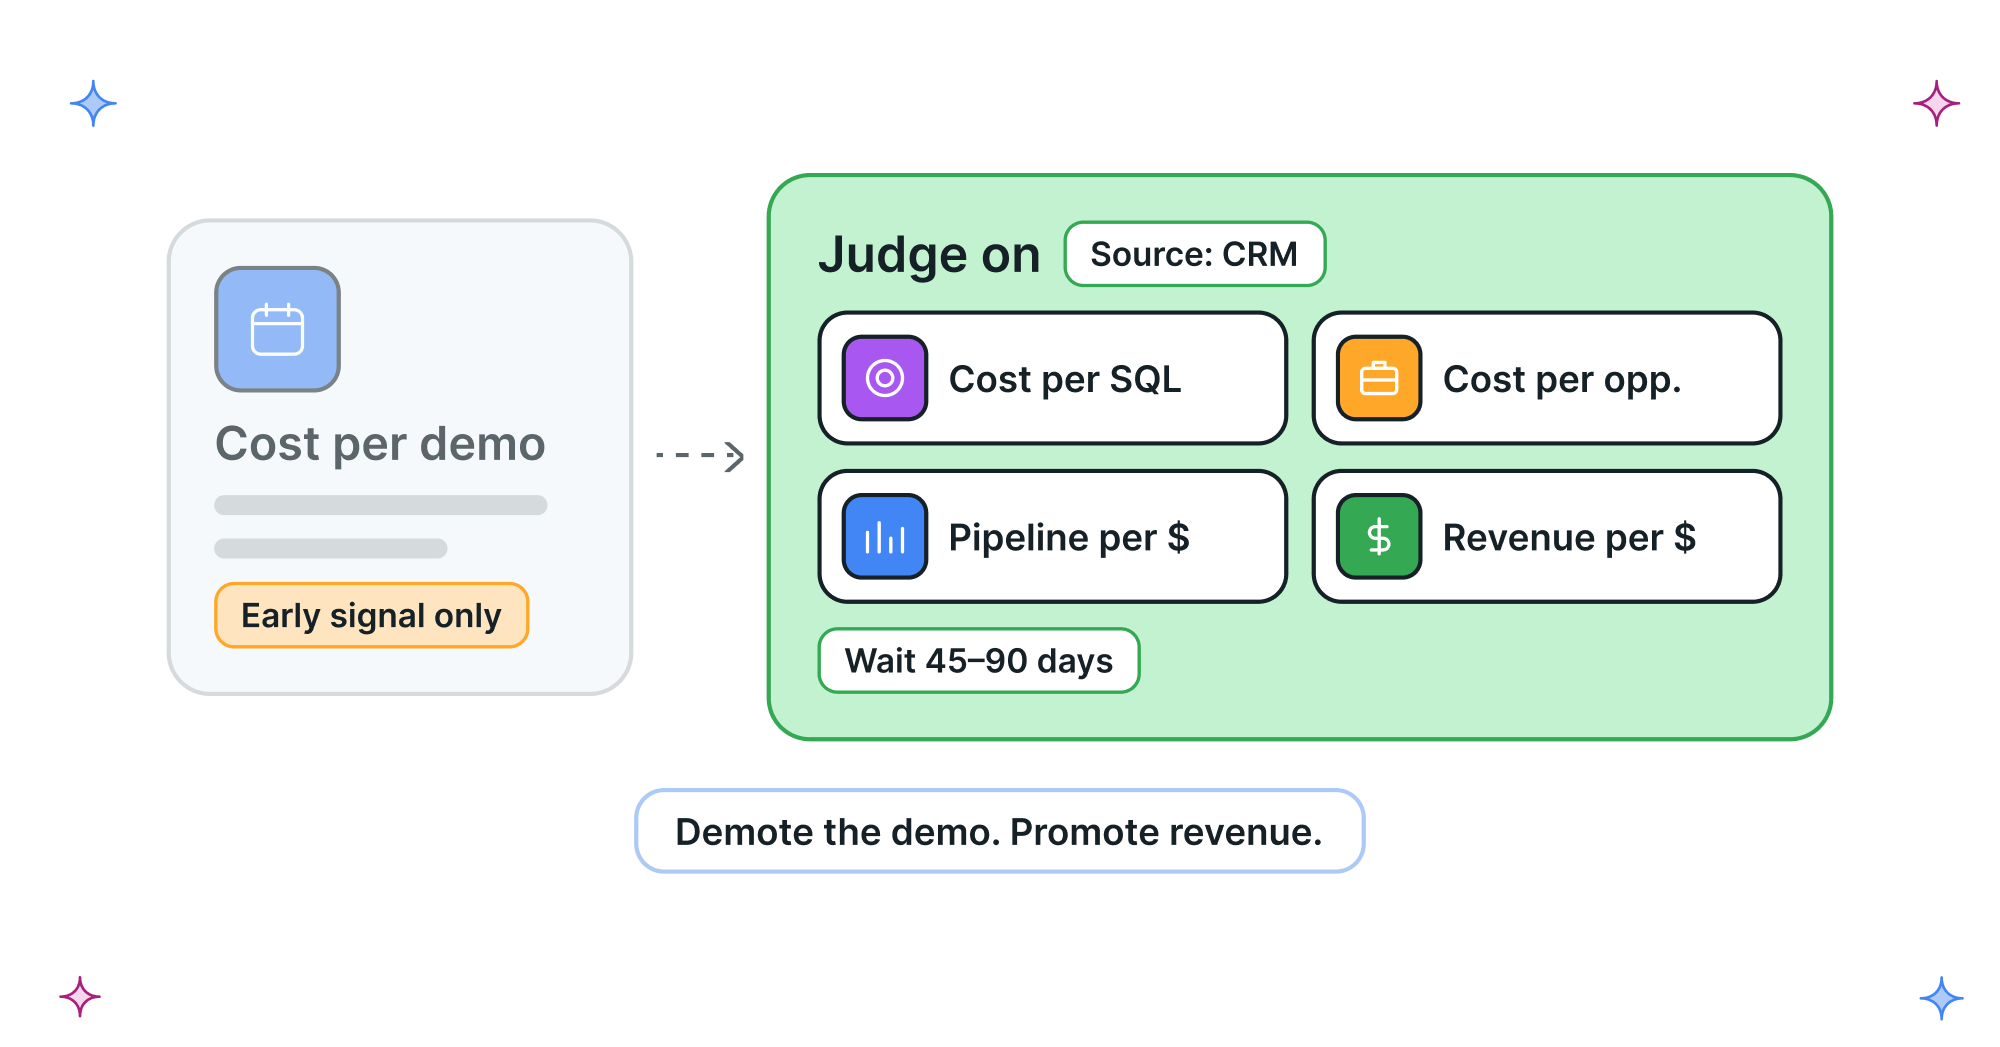
Four: cost per sales qualified lead, cost per opportunity, pipeline value per dollar spent, and closed-won revenue per dollar spent.
You do not drop cost per demo. You demote it. It becomes an early warning signal rather than the headline number.
[table]Metric | What it answers | Where the number comes from
Cost per SQL | Are we attracting people sales can sell to? | CRM, not Google Ads
Cost per opportunity | Are those people creating real deals? | CRM
Pipeline per $1 spent | Is the channel building future revenue? | CRM deal values
Closed-won per $1 spent | Did the channel pay for itself? | CRM, one cycle later
Demo-to-SQL rate by campaign | Which campaigns bring the wrong people? | CRM, split by campaign[/table]
Cost per SQL becomes readable in two to three weeks. Cost per opportunity in four to six. Pipeline per dollar in six to eight. Closed-won revenue takes a full sales cycle. The first two tell you whether to change the campaigns. The last two tell you whether the channel is working. Do not confuse the jobs.
Every one of these numbers lives in your CRM, not in Google Ads. That is the point, and it is also the problem to solve next.
How do you connect Google Ads to your CRM revenue data?
You capture a unique click identifier with every lead, store it in your CRM, and send the outcome back to Google when the deal moves forward.
Google gives each ad click an identifier called a GCLID. Your form captures it as a hidden field. Your CRM stores it against the contact. When that contact becomes an SQL or closes, you send the GCLID and the value back to Google.
There are two ways to do this. Enhanced conversions for leads matches on hashed customer data and is now Google's recommended route. The older offline conversion import matches on the GCLID directly. Most CRMs, including HubSpot and Salesforce, can do either with a native integration.
We have written the full setup in our guide to offline conversion tracking for Google Ads, which covers the field mapping and the common failure points.
Without the return trip, the loop never closes and the algorithm keeps buying form fills.
How do you use revenue data to improve the campaigns?
Once Google is receiving deal values, you move the bidding from maximising conversions to maximising conversion value, so it buys clicks that look like your revenue rather than clicks that look like your forms.
This is called value-based bidding. Instead of treating every conversion as worth the same, you tell Google what each one was actually worth. The algorithm then chases the expensive ones.
Two warnings before you switch.
- You need volume. Value-based bidding needs a steady stream of conversions with values attached. Below roughly 30 value-bearing conversions a month, it has too little to learn from.
- Use stage values, not just closed-won. Closed revenue arrives too late to steer bidding. Many teams assign an estimated value at the SQL stage, then correct it at close. That gives the algorithm something to work with inside a reasonable window.
Attribution, which decides how credit is divided when a buyer touches several campaigns, is a separate problem with its own rules. We cover it in Google Ads attribution for B2B SaaS.
How long before revenue data is reliable enough to act on?
Give it one full sales cycle, so 45 to 90 days for most B2B SaaS companies, before closed-won data can steer your bidding or your budget.
This is the part that costs teams the most money. Demos arrive within days. Revenue arrives a quarter later. If you judge a campaign in week three on revenue it has not had time to produce, you will switch off campaigns that were working.
A practical sequence:
- Weeks 1 to 2. Watch demo volume and cost per demo only. You are checking the plumbing works, not judging quality.
- Weeks 3 to 6. Cost per SQL becomes readable. Start comparing campaigns on demo-to-SQL rate.
- Weeks 6 to 10. Cost per opportunity and pipeline per dollar become readable. This is where budget decisions get made.
- One full cycle onward. Closed-won revenue per dollar. This answers whether the channel pays.
If you want to work out what those numbers need to be for your own deal size and close rate, our Google Ads ROI calculator for SaaS runs the CAC and LTV:CAC maths directly.
The weekly report runs the account. The quarterly revenue read decides whether the channel keeps its budget. Mixing the two is how good campaigns get killed early.